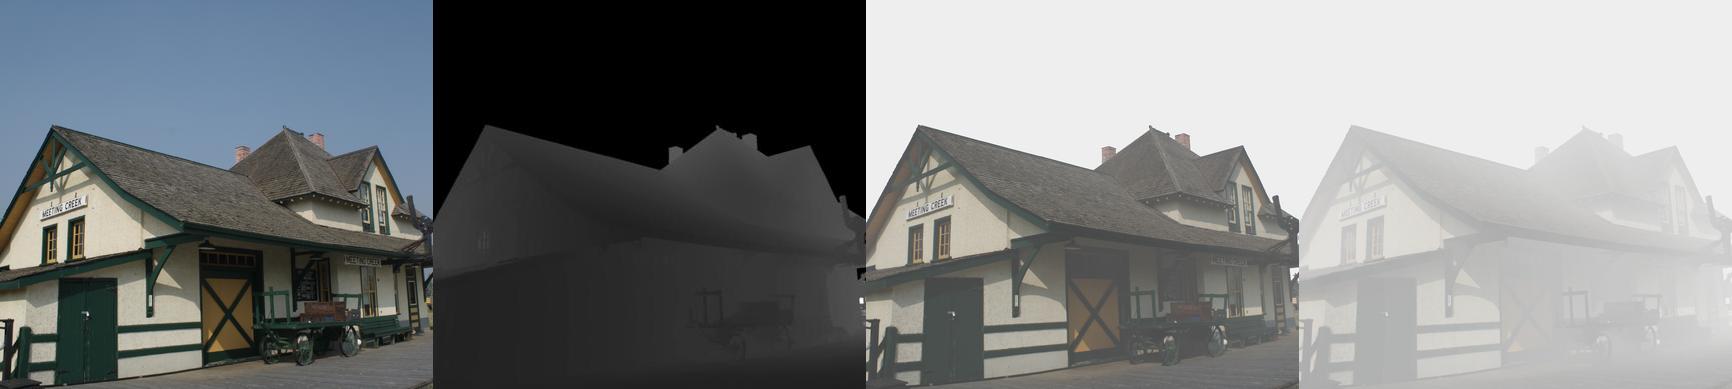
HazeRD samples. From left to right: haze-free image, depth map, simulated hazy images with the visual range of 500m and 50m, respectively.
We proposed a new dataset, HazeRD, for benchmarking dehazing algorithms under realistic haze conditions. As opposed to prior datasets that made use of synthetically generated images or indoor images with unrealistic parameters for haze simulation, our outdoor dataset allows for more realistic simulation of haze with parameters that are physically realistic and justified by scattering theory.
- Datasets
- HazeRD contains 14 haze-free RGB images of real outdoor scene and corresponding depth maps
- We provide a matlab function that can generate the hazy image for different haze parameters.
- A demo script is also provided that generates the hazy images that have been used for benchmarking in our paper.
- Downloads
- Please complete this Google Form to request Dataset and Code (Matlab).
- If you have difficulty accessing the Google Form, you can instead download it from IEEE DataPort.
- Benchmarking
- Sample Results
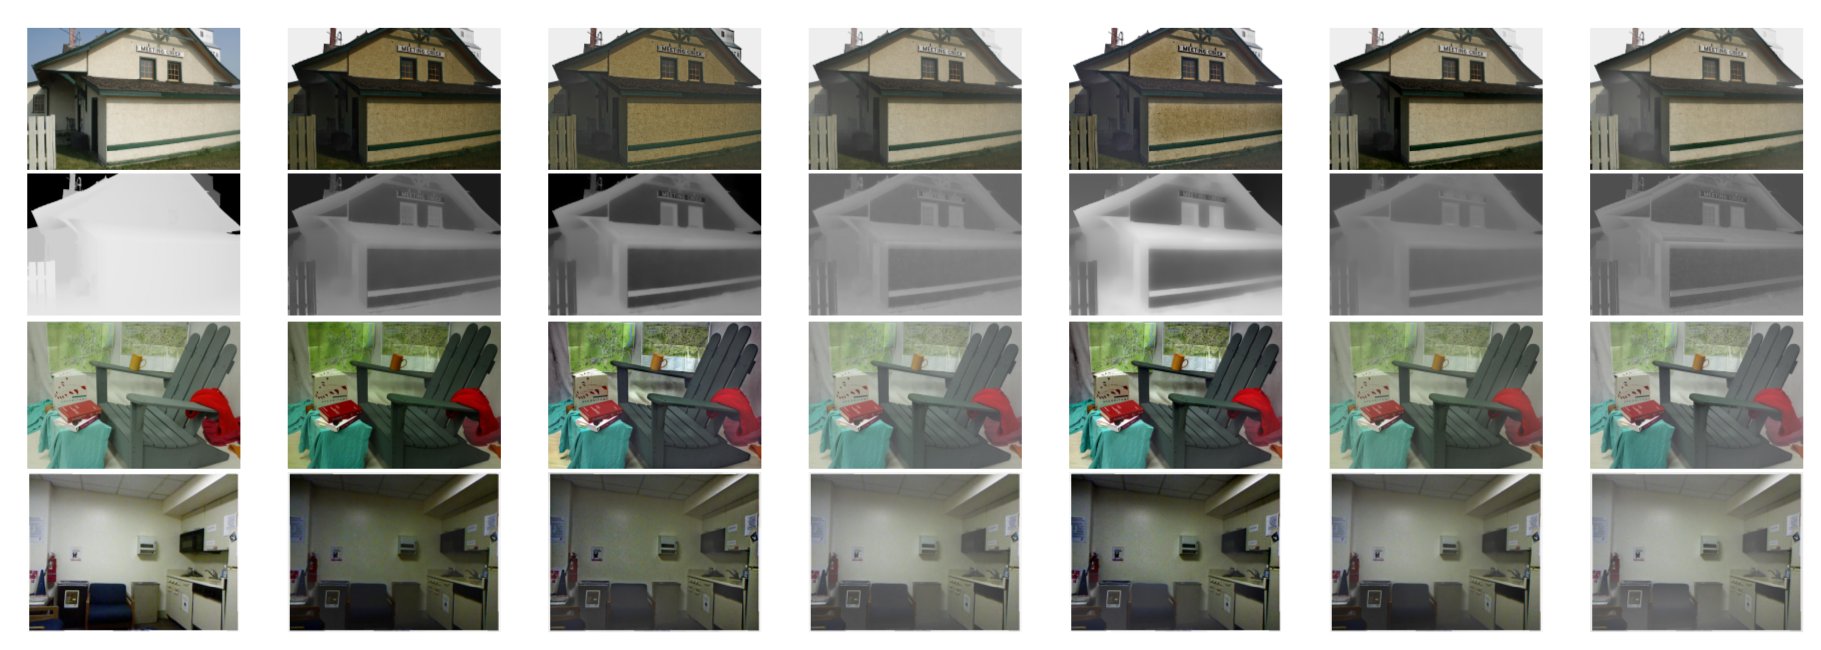
Sample results from different dehazing algorithms on images from different datasets. First row from left to right: a haze free image from HazeRD, and the results of dehazing of a corresponding hazy image obtained with: He, Meng, Zhu, Berman, Cai, Ren; second row from left to right: the ground truth transmission, and the transmission estimates corresponding to the estimated images in the top row; third row from left to right: a haze free image from Middlebury, corresponding dehazed images in the same order of algorithms previously listed; fourth row from left to right: a haze free image from the NYU dataset, and corresponding dehazed images. The alternative methods (He, Meng, Zhu, Berman, Cai, Ren) benchmarked here are identified in the paper along with associated references (link below)
- Quantitative Comparisons
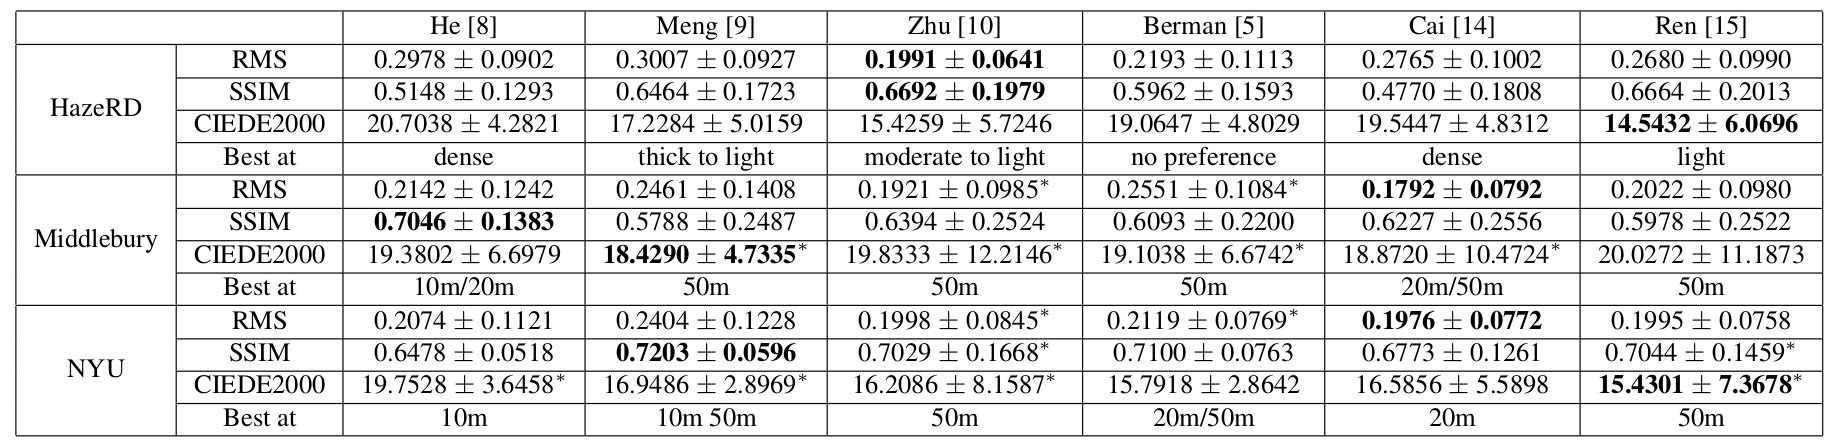
Performance of different dehazing methods on HazeRD, Middlebury, and NYU datasets. Each numerical entry is represented as the average over the images in the dataset±the standard deviation. The best performing algorithm for each dataset is indicated in bold font, and *
in the Middlebury and NYU datasets indicates cases where the difference with respect to HazeRD was not statistically significant (5% level).
Publication