Li Ding, Mohammad H. Bawany, Ajay E. Kuriyan, Rajeev S. Ramchandran, Charles C. Wykoff, and Gaurav Sharma, “A Novel Deep Learning Pipeline for Retinal Vessel Detection In Fluorescein Angiography”, IEEE Transactions on Image Processing, vol. 29, no. 1, pp. 6561–6573, 2020
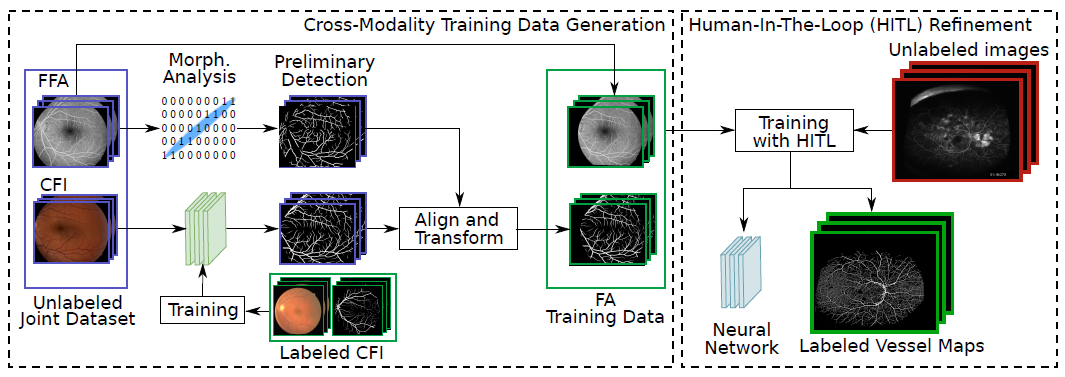
While recent advances in deep learning have significantly advanced the state of the art for vessel detection in color fundus (CF) images, the success for detecting vessels in fluorescein angiography (FA) has been stymied due to the lack of labeled ground truth datasets. We propose a novel pipeline to detect retinal vessels in FA images using deep neural networks (DNNs) that reduce the effort required for generating labeled ground truth data by combining two key components: cross-modality transfer and human-in-the-loop learning.
- Contributions
- We propose a novel pipeline for generating ground truth data for retinal vessel segmentation in FA that significantly reduces the annotation efforts.
- We construct a new ground truth dataset, RECOVERY-FA19, for the development and evaluation of retinal vessel segmentation algorithms in FA.
- We develop and evaluate the first set of deep neural networks for retinal vessel segmentation in both ultra-widefield FA and narrow-field fundus FA images. [GitHub] [Code Ocean capsule]
- RECOVERY-FA19: Ultra-Widefield Fluorescein Angiography Vessel Detection Dataset
- RECOVERY_FA19 dataset contains 8 high-resolution (3900×3072 pixels) UWF FA images and corresponding labeled binary vessel maps.
- UWF FA images are acquired using Optos California and 200Tx cameras (Optos plc, Dunfermline, United Kingdom). Ground truth binary vessel maps are annotated using the proposed pipeline.
- You can download the dataset from IEEE DataPort. This is an open-access dataset available to all IEEE users (IEEE Accounts are FREE).
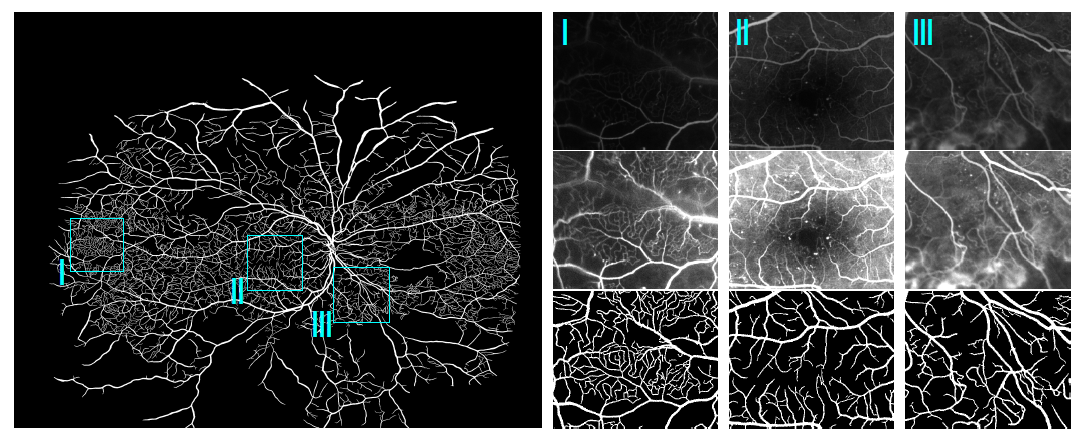
Example of labeled ground truth vessel map from the RECOVERY-FA19 dataset. Enlarged views of cyan rectangles are shown on the right (top: original view; middle: contrast-enhanced view; bottom: labeled ground truth).
- Sample Results
- Quantitative results on RECOVERY-FA19 dataset
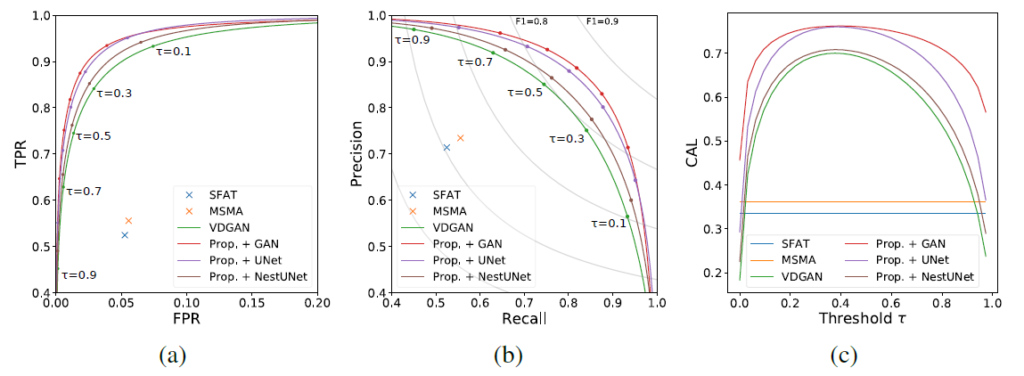
(a) ROC, (b) PR, and (c) CAL curves for different methods on the RECOVERY-FA19 dataset. The gray curves in (b) represent the isolines of Dice coefficients. The small circular dots on the curves in (a) and (b) identify the corresponding values of the threshold.
- Visual results on RECOVERY-FA19 dataset
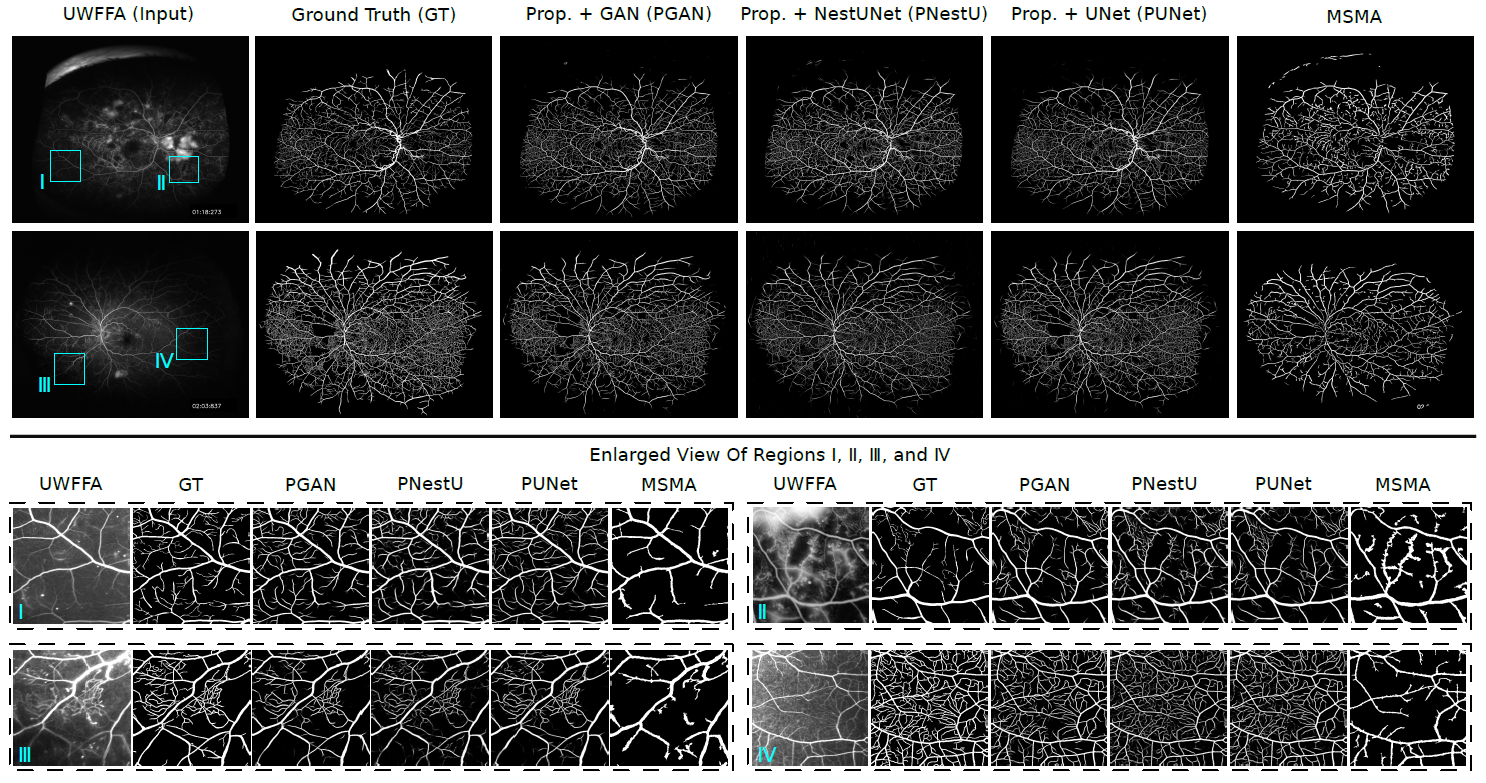
Qualitative comparison of results obtained with different algorithms for images from the RECOVERY-FA19 dataset. For each full image, two contrast-enhanced enlarged views of the selected regions (shown by cyan rectangles) are also included.
Publication